Building Momentum: Key Drivers for Equity Issuance in 2025
With the U.S. presidential election behind us and monetary policy easing, the equity markets are wrapping up another year of remarkable ~24% returns for the S&P 500. The risk-on trade is expected to extend into 2025, and investors will likely continue to seek alpha through active participation in equity transactions.
2025 ECM Drivers
Bright Macroeconomic Prospects
The U.S. economy is projected to maintain steady growth in 2025 driven by robust consumer spending and sustained business investment, particularly in technology and infrastructure. Easing monetary policy with the Fed’s rate cut cycle under way should support continued growth, but inflation may persist as potential risks around tariffs and government deficits build. Following the December FOMC meeting and updated outlook, market expectations quickly pivoted to 25-50bps of rate cuts in 2025 and an implied target rate of ~4% by year-end.
Strong Performance after an Election Year
The market avoided a spike in volatility around the presidential election and responded with the best weekly performance in well over a year following a decisive result. In the last five election cycles, equities have outperformed the year following a presidential election year by a median of 24%. IPO activity tends to increase even more, with YoY deal volume increasing post-election year in four of the last five election cycles by a median of 80%. Eliminating the election overhang also opens another marketing window for issuers in Q4 leading to greater execution flexibility in the second half of 2025.
Market Participants are Ready for a Rebound
Equity issuance has been muted since October 2022 which has led to both a large backlog of companies seeking a sustained IPO window and pent-up demand from investors for new ideas. Historically, equity issuance slowdowns have taken ~12 months to recover after hitting market lows while taking ~24 months to return to normalized levels. We approach that benchmark as we enter 2025, and many indicators are flashing green for issuers to come to market.
Historical IPO Market Activity
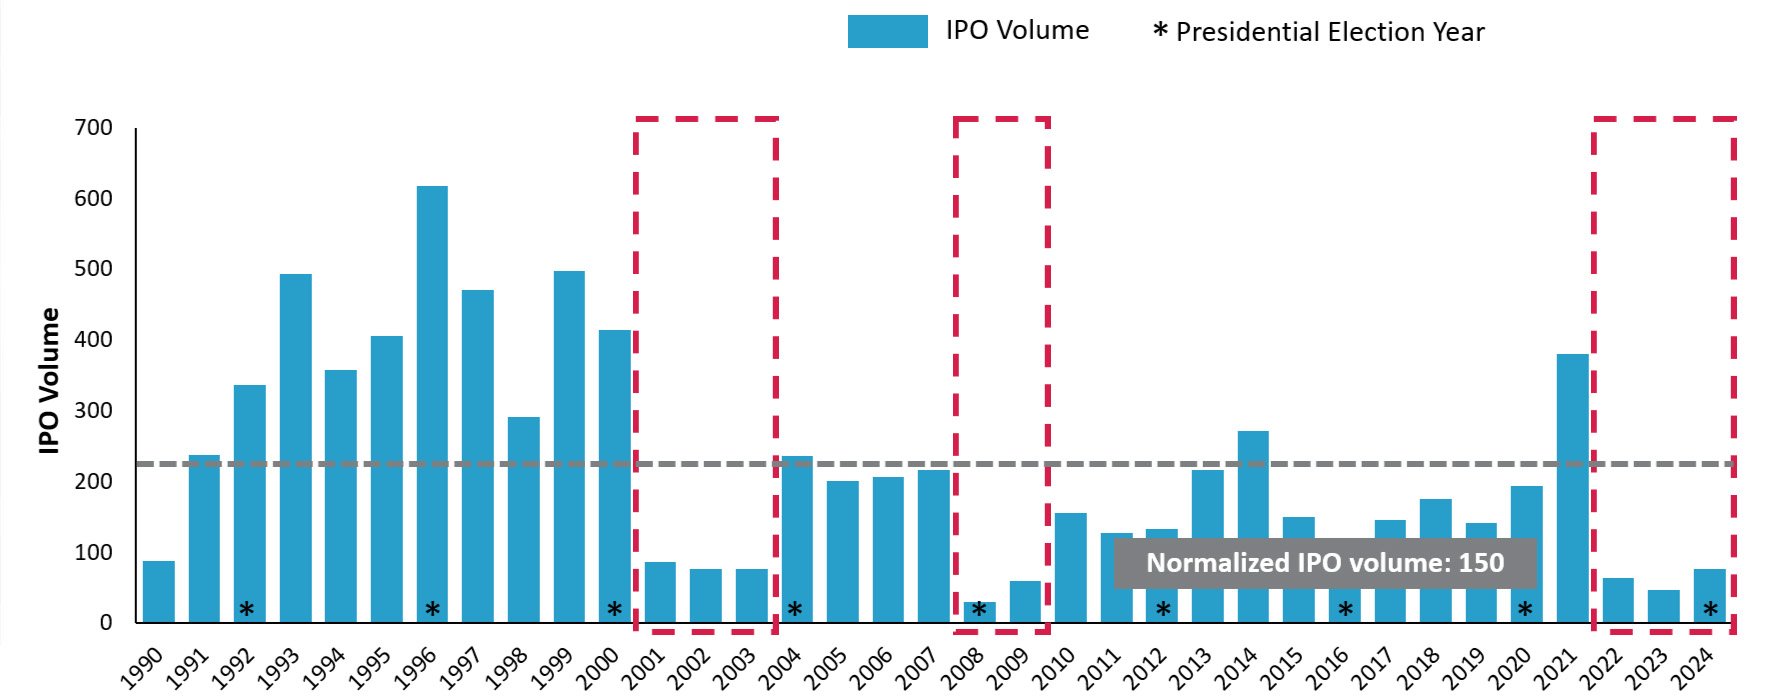 Source: CMG as of December 20, 2024. Excludes deals under 15 million.
Investors are Warming up to Risk-on Sentiment
Small-cap stocks outperformed in the second half of the year as confidence grew around future earnings growth and lower borrowing costs. Q4 IPOs have also delivered attractive returns to investors, trading up 12% on the first day and 25% 30-days post offering, on average. The year was also marked by a continued rotation into growth sectors with Communication Services, Information Technology and Consumer Discretionary driving index returns in 2024, trading up 39%-46% and leading to an improved valuation backdrop for IPO candidates.
Market Performance in the Second Half of 2024

Source: FactSet as of December 20, 2024
Receptive Follow-on Market
The follow-on market continues to improve as sponsors seek liquidity after successful 2023-2024 IPOs and primary capital raises have been well received by investors. 424 follow-on offerings priced in 2024, up 13% compared to 2023 and the highest volume since 2021’s high mark. Of note, 69 issuers completed their first back-to-market follow-ons, including 24 secondary transactions, supporting a positive backdrop for a path to liquidity for issuers and sponsors seeking to explore the public exit option in 2025.
Follow-on Market Recap
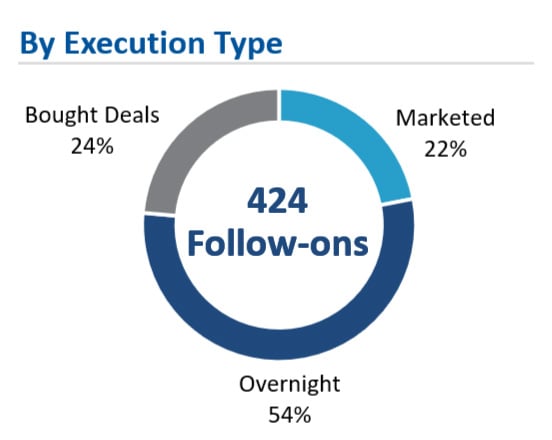
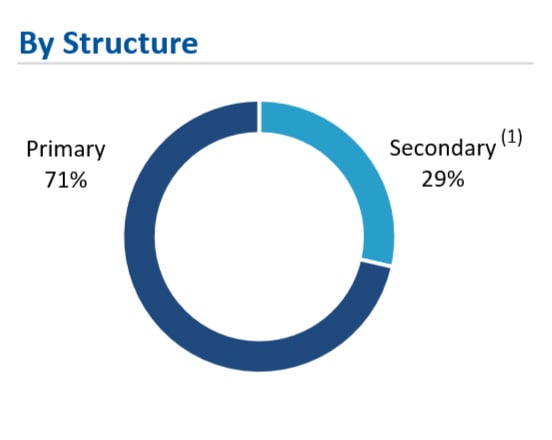
Source CMG as of December 20, 2024. Excludes deals under $15 million.
(1)Secondary deals defined as 50%+ secondary transactions.
Please contact Baird’s Equity Capital Markets Desk to discuss the market landscape and your capital raising plans for the upcoming year.
Baird ECM Momentum

389
equity transactions since 2020

$163 billion
in capital raised since 2020
![]()
#1 Ranked
Institutional Equities platform over the last 10 years (1)
(1) Ratings from Coalition Grennwich 2014 - 2023 surveys of North AMerican Equity Investors. Based on an average of 98 small-cap and mid-cap fund managers and 276 traders over the 10-year period.

