A Promising Year Ahead for M&A
Baird’s Outlook for 2025’s M&A Market
Global M&A market activity should accelerate in 2025 after mixed results this year. Sound fundamentals for sponsor and corporate deal flow should translate to a full M&A pipeline and strong interest from buyers throughout next year. We expect more transactions to reach the finish line in 2025 based on favorable shifts for key M&A variables and leading indicators. Challenges to completing deals will persist even in a better backdrop, making asset-specific process design and execution essential.
Review of 2024 M&A Activity
The broad-based rebound anticipated for the global M&A market in 2024 has not fully materialized. Despite substantial pent-up demand and supply following lower transaction totals in 2022-2023, this year is on track for a relatively flat deal count. However, deal value is showing moderate growth from 2023’s 10-year low, including the average monthly deal value for H2 2024 (through November) exceeding the first-half figure by 11%.
The M&A recovery was slowed by:
- Financing costs remaining elevated due to central bank rate cuts arriving later than expected
- A significant subset of the buyer universe adopting a risk-off approach amid sustained macro uncertainty
- Many sellers anchoring on valuations seen near the peak of the M&A cycle
The global M&A market has featured several promising indicators during 2024, helped by increased support from the financing markets as the year progressed:
- Strength for $1+ billion deals
- A return to growth in the $100 million to $1 billion segment
- Substantial gains for PE M&A exit activity
2024 M&A Market Summary
| (vs. 2023) | Deal Count | Deal Value |
| Global M&A | -1% | +12% |
| Global $100M - $1B | +2% | +5% |
| Global $1B+ | +22% | +16% |
| Global PE M&A Exits | +23% | +26% |
| Global PE Acquisitions | +1% | +24% |
| Global Strategic Acquisitions | -2% | +8% |
| U.S. M&A | -1% | +4% |
| U.S. PE M&A Exits | +25% | +5% |
| U.S. PE Acquisitions | +3% | +26% |
| Europe M&A | 0% | +24% |
Source: Dealogic.
Full-year 2024 data is estimated, assuming pro-rated data for December 2024.
Overview of 2025’s M&A Market
We are confident in the global M&A market’s prospects heading into 2025, when we expect plenty of buyers and sellers to prioritize their M&A plans after a slower period for deal activity. The status of several critical factors points toward more transaction signings over the course of the next year, even amid continued obstacles to deal making.
Positive M&A Market Outlook for 2025
| Strong deal flow and robust buyer demand |
| Sponsors prioritizing liquidity for large base of portfolio assets |
| PE poised to delpoy more capital at lower cost of debt |
| Strategic M&A supported by public markets and increased cash |
| Corporate divestitures rebounding from 2023's 27-year low |
| Key variables and leading indicators pointing upward |
| Pro-business backdrop, less M&A regulation post U.S. elections |
| Improving 2024 for leading M&A indicators |
| Baird's record pitch activity and backlog bode well |
| Central bank cuts to push yields lower, leverage higher |
| Progress for ongoing challenges to M&A deal close rates |
| Buyer interest should broaden as backdrop improves |
| U.S. policy clarity in H1 2025 to reduce macro uncertainty |
| Potential for valuation gap to narrow as leverage ratios rise |
Solid M&A Market Fundamentals to Fuel Deal Flow
Financial Sponsors Determined to Drive Distributions
Our confidence in sponsor exits as an engine for the M&A market is based on PE firms prioritizing liquidity events to support future fundraising, prospective buyers accessing conducive financing markets, and Baird’s sellside advisory engagements featuring stronger metrics.
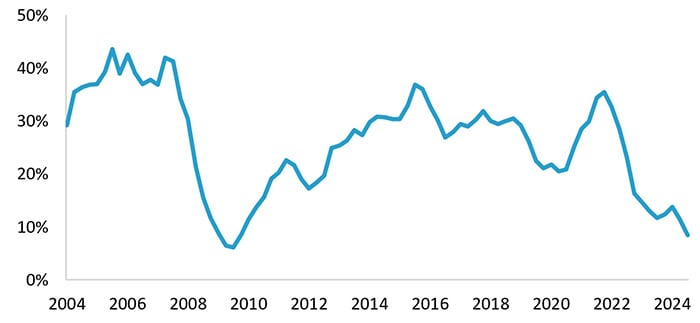
- The ratio of U.S. buyout fund distributions to paid in capital (DPI) fell to a 15-year low for the 12-month period through Q3 2024, as DPI of 9% was far below the 2014-2023 average of 27%.
- The pickup in M&A exit activity in 2024 (tracking toward a 20%+ increase vs. 2023’s 10-year low) reflects PE firms launching new sale processes and reviving many dormant projects, with sponsors attempting to expand the number of realizations beyond the highest-quality portfolio companies as market conditions improve.
- The vast supply of PE portfolio companies represents a lengthy monetization to-do list for sponsors. After September 2024, the U.S. PE portfolio company count of 11,500+ was 21% above the total from year-end 2019.
- Urgency to achieve liquidity from portfolios is also apparent in the average holding period of current U.S. PE portfolio companies rising to 5.4 years at the end of Q3 2024, up half a year from 2019.
- Distributions should also benefit from more GPs evaluating the liquidity potential of continuation vehicles for limited partners as well as the increased viability of recapitalizations as financing rates fall.
- Success in returning capital to LPs would enhance the odds of meeting fundraising objectives. Through Q3, 2024 was on pace for a four-year low for PE capital raised and a 14-year low for the number of PE funds to close on a global basis.
Buyout Fund Distributions as % of Beginning NAV

Source: PitchBook. Data points are calculated on a trailing 12 months basis.
Latest data is through September 30, 2024
Note: The distributions for the two most recent quarters were estimated from exit value.
Private Equity Eager to Deploy Capital
Financial sponsors should also be in investment mode during 2025, supported by beneficial lending market conditions and the uptrend for portfolio exits.
- After making fewer and smaller bets over the prior two years, PE firms have taken on larger acquisitions in 2024, backed by healthier leveraged finance markets. On a global basis, the disclosed deal value of sponsor acquisitions is estimated to increase 24% in 2024 even as the transaction count hovered near the depressed levels of 2022-2023.
- Across geographies, Technology / Software has remained the leading sector for new sponsor investments in 2024. Relative strength in other industries suggests an expanding appetite among PE buyers:
- In the U.S., the Consumer sector accounted for about 15% of investments in Q1-Q3 2024 (according to PitchBook), up from 10% in 2022-2023.
- In Europe, the Industrial sector represented almost 30% of middle-market PE investments in 2023-2024, the highest figure in the last decade. In contrast, the Consumer sector fell from a 30% share of 2014-2016 PE investments to 12% in 2023 before edging upward to 14% in 2024.
- The Potential for M&A Demand to Broaden section below notes encouraging signs of wider buyer interest in Baird’s recent advisory deals and current backlog.
- Sponsors have immense pent-up demand in view of $2.5 trillion of global dry powder, which has risen 16% since the start of 2020, in part due to tempered acquisition spending in 2023-2024.
- Building momentum for sponsor M&A exits promotes additional PE buying by making fundraising easier for successful sellers and by expanding the supply of viable targets.
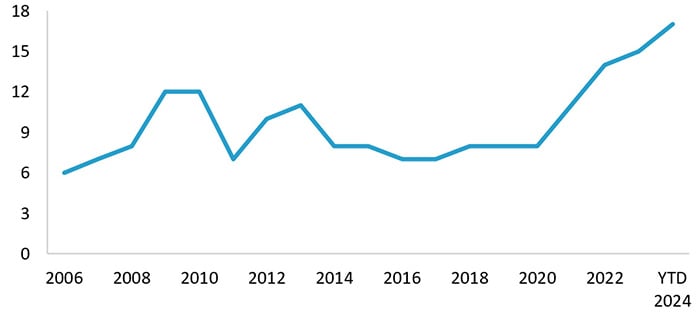
- Financial sponsors would welcome relief on the fundraising front given extended timing cycles. PE funds closing in YTD 2024 required an average time to final close of 17 months (after first close), up from 15 months in 2023, 14 months in 2022, and the 6-12 month range of 2006-2021.
PE Funds - Average Months from First Close to Final Close

Source: Preqin.
YTD data is through November 30, 2024.
Corporate Acquirors Acting on Strategic Plans
Corporates have the financial means and motivation to increase their acquisition activity during 2025 after another year of below-average buying in 2024.
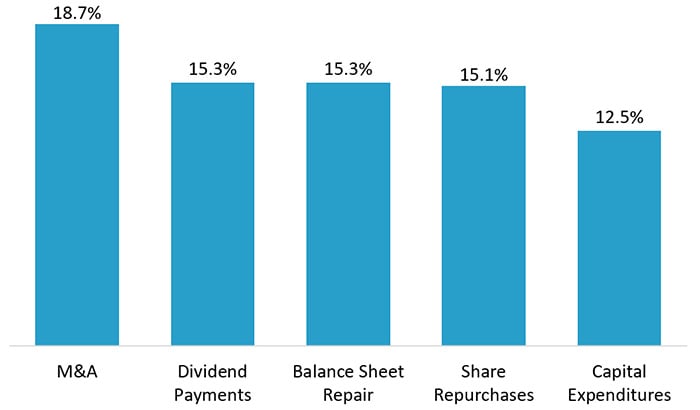
- Strong recent stock performance for the most active corporate acquirors could embolden more strategics to lean into their M&A playbooks. Over a recent 12-month period, the stocks of the S&P 500 companies in the top quintile for cash M&A outlays outperformed all other groups (per Strategas analysis depicted below).
- The extended stock market rally (e.g., S&P 500 up 50%+ since the start of 2023) has enhanced the value of shares that can be used by public companies for M&A; stock was a component of consideration in nearly half of $1+ billion acquisitions announced by public companies in YTD 2024.
- Elevated stock values and realizable cost / revenue synergies should enable corporates to be highly competitive in processes that also include PE buyers, which typically are more reliant on lower-cost debt.
- Post Q3 2024 reporting, balance sheet cash for publicly traded companies (excluding the finance sector) based in the U.S., Europe, or Japan totaled $3.7 trillion, up 15% from five years earlier. Continued corporate earnings growth should add to cash positions; for example, 2025 EBITDA is estimated to increase 12% for the S&P 500.
- We expect corporates across sectors to prioritize strategic acquisitions in 2025. At Baird’s 54th annual Global Industrial Conference (summarized here), we observed strong M&A appetites among participating companies. Corporate M&A strategies often focus on gaining exposure to secular growth themes, such as (in the Industrial sector) datacenter buildouts, automation, power grid infrastructure, and IoT / software. Corporates are seeking to enhance earnings quality by adding recurring revenue streams, including from next-generation technologies as well as aftermarket products and services.
- Factors supporting a more aggressive approach among corporates also include anticipation of relaxed antitrust enforcement for M&A under the Trump administration, as described further in the U.S. election section below. Transformative combinations are now more likely, with megadeals potentially causing a powerful ripple effect within industries, including divestitures as well as transactions undertaken by competitors in response.
S&P 500 First Quintile Cash Outlet Performance - LTM 2024

Source: Straegas. The gains shown for each category are based on the performance of the stocks of the top 20% of S&P 500 companies for cash spending on each category in the LTM period through October 31, 2024.
Corporate Assets Expanding the Pool of Targets
We expect more corporates to capitalize on the M&A recovery by following through on divestiture efforts intended to streamline business models.
- Incremental corporate selling is critical to enhancing the supply side of the M&A equation. Public company divestitures (excluding listed sponsors) represented 16% of all global M&A activity over the past 10 years. During M&A market weakness in 2023, public company divestiture activity dropped to a 27-year low and accounted for only 14% of transactions.
- The number of public company divestitures increased 5% in Q1-Q3 2024 (when overall M&A deal counts contracted further), indicating that corporates are increasingly undertaking portfolio rationalization, a trend that should gain steam as more sponsor and strategic buyers seek targets.
- While corporates execute on divestitures for various reasons, the rationale frequently is centered on establishing a more focused equity story for investors by carving out units to align with secular growth themes and to reduce cyclicality.
- The extended strength seen in the public equity markets could induce companies with lagging stock performance to pursue divestitures in order to placate investors and play defense versus potential activists.
Key Variables and Leading Indicators Shifting in Favor of M&A in 2025
U.S. Elections a Net Positive for M&A Amid Many Uncertainties
The outcomes of recent U.S. elections should lead to a business-friendly environment with less regulatory scrutiny on deal activity, although policy-related unknowns include the potential for tariff-driven inflation to limit central bank rate cuts.
- The M&A regulatory backdrop should ease after tightening in recent years (including revised merger guidelines announced in late 2023), thereby expanding the consolidation appetites of corporate and sponsor buyers.
- Pro-business conditions also include the retention of prior corporate tax cuts, the prospect of new tax reductions, and potential rollbacks of existing regulations on business activity. These factors should bolster the confidence of corporate management teams.
- While the incoming administration takes over a stable economy with inflation moderating and GDP averaging above 2% in Q1-Q3 2024, the soft landing could be at risk depending on the effects of tariffs, deportations, and government efficiency initiatives.
- We expect the new administration to be highly attuned to the net impact of its policies on economic growth, inflation, and interest rates, with rapid adjustments as warranted.
- The dynamic tariff situation will dominate near-term headlines given proposed rates on imports from China, Mexico, and Canada (top three national trading partners of the U.S.) and potential tariffs involving Europe, with market participants seeking clarity on how tariff rhetoric translates to policy implementation and retaliatory tariffs.
- Any signs of a second inflation wave could cause the U.S. Federal Reserve to slow the pace of planned rate cuts. Current market expectations for Fed rates imply 75-100 bps of further rate reductions over the next year (including the Fed’s December 2024 meeting) on top of 75 bps of combined cuts in September-November 2024.
Leading Indicators Pointing Upward
Growth in key M&A segments and strength in the equity markets represent positive signals for future M&A activity.
- Our analysis of past cycles revealed that U.S. transaction metrics for (1) M&A deals with announced value of $1+ billion and (2) private equity M&A exits are useful leading indicators of an upcoming rebound in the broader M&A market (as detailed extensively here).
- Throughout this year, these categories have experienced significant growth even as other parts of the M&A market have yet to recover, demonstrating the potential for a widespread revival in the M&A markets in 2025.
- In 2024, the number of $1+ billion U.S. deals is on pace for 25% growth from the 2023 figure.
- The transaction count for U.S. sponsor M&A exits also tracked toward 25% growth in 2024.
- In past M&A cycles, significant growth in these segments at this stage of the M&A cycle was a precursor to subsequent annual deal growth exceeding 20% across the M&A market.
- Substantial gains in the equity markets also suggest an upturn for deal making in 2025.
- The 2003-2023 period included eight years when the return for the S&P 500 exceeded 16%, a level easily surpassed by YTD 2024’s gains. During those eight years, the number of U.S. M&A transactions was flat on average (as in 2024), whereas deal counts in the following years rose an average of 12%.
- Sizable equity market rallies (as seen in 2024) reflect increased confidence for investors while also frequently corresponding to higher levels of conviction in the outlook among management teams, as needed for the M&A market to strengthen.
Baird’s Recent Activity Bodes Well
Our optimism regarding the value of the leading indicators cited above is also a function of strong metrics throughout Baird’s global M&A advisory business.
- The number of pitches in the last three months (September through November) was the highest three-month count in our history (including a single-month record in November) and exceeded last year’s quarterly average by 67%, indicating that many more sellers are ready to bring assets to the M&A market.
- Our record backlog of current M&A mandates ended November 20% above the November 2023 level. The active backlog expanded significantly even after 45% growth for signed/completed M&A advisory transactions during YTD 2024 through November.
- The number of sellside process marketing launches in the past three months rose 31% from 2023’s quarterly average.
- Encouraging process data includes more competitive buyer behavior in our recent sellsides, such as increases in the number of IOIs and final bidders as well as significant improvement in bid progressions.
- Due to the dynamics listed above as well as successful bridging of bid-ask spreads through negotiations and structuring, the YTD 2024 median EV/EBITDA valuation on our sellsides has risen half a turn from last year’s multiple.
- Looking ahead, building momentum is also evident in our European M&A advisory business, where rising pitch activity should translate to growth in sellside process launches and deal signings during 2025.
Substantial 2024 Growth in Baird's Sellside Advisory Activity

Financing Markets Constructive
The private and public lending markets are primed to support acceleration for buyouts, as financing market conditions feature aggressive lender competition and tighter spreads for new loans to suitable credits.
- Recent leveraged finance activity has included more contribution from buyout financings amid strong lender demand for new opportunities. For example, global volume for M&A financings in the broadly syndicated markets climbed 81% in YTD 2024 through November, including a 10-quarter high in Q3.
- As discussed in our recent piece about the impact of Fed rate cuts, past trends suggest that M&A activity should benefit from reductions in loan pricing and resulting increases to leverage ratios and purchase price valuations. Today’s backdrop appears favorable relative to the rate cut phases of previous cycles, supporting the case for LBO leverage ratios to rise.
- Following initial Fed rate reductions, yields on broadly syndicated loans and direct lending deals in the U.S. dropped to 100+ bps below year-ago pricing, with further downside potential pending additional Fed cuts if inflation remains near targeted levels.
- In Europe, central bank rate cuts have contributed to a meaningful downtrend for pricing, as yields on recent term loan B issues were 125-150 bps under prior-year levels.
- Lower pricing also reflects competition among banks and private credit funds flush with capital. According to Preqin, private debt dry powder of $440 billion (as of late 2024) was up 27% since the end of 2019.
- Lenders will continue to offer significantly more attractive terms to high-quality credits relative to those available to borrowers with complex stories or significant exposure to the economic cycle.
Ongoing Challenges to Deal Making Could Subside
Potential for M&A Demand to Broaden as Macro Picture Comes into Focus
Although the global M&A market is still bifurcated among “haves” and “have-nots” heading toward 2025, we expect a risk-on approach from buyers if macro uncertainty abates, indicating potential for improvement in sellside process close rates.
- Over the past two-plus years, buyers have chased top-tier assets much more aggressively than businesses deemed to have cyclical or operational risks.
- The highest-quality companies have continued to trade at hefty premiums due to investor interest concentrating on scarce assets. In contrast, targets facing questions about business model resilience often have experienced a weaker reception from buyers and lenders.
- As a result, some financial sponsors have been reluctant to launch processes due to concerns about close rates for second-tier assets, dampening the overall M&A market recovery.
- As noted in the private equity buyer section above, broadening in sponsor acquisition activity by sector during 2024 is a positive signal for a more widespread rebound for deal making.
- At the same time, Baird Global Investment Banking has seen a notable increase in close rates across our sellside processes to date in 2024, along with year-over-year growth in deal count for each of our sectors of focus: Consumer, Healthcare, Industrial, and Technology & Services. Furthermore, the number of engagements in our current backlog is up by a double-digit percentage from year-ago levels across all of these sectors.
- As the new year approaches, macroeconomic and geopolitical conditions remain uncertain following the recent U.S. elections. However, the first part of 2025 should bring a meaningful degree of clarity regarding policy changes, helping buyers and sellers assess the impact on target businesses.
Scope for Valuation Gap to Narrow
For many sellside processes in 2025, the primary gating factor will remain the willingness of sellers to accept the market clearing price for their assets, with reasons to expect progress toward the valuation gap closing.
- In terms of publicly disclosed multiples, the median EV/EBITDA multiple for buyouts in Q1-Q3 2024 was slightly over 9x on a global basis, consistent with the 9.0-9.5x range of 2022-2023 (for the low percentage of deals with disclosed multiples data). Recent multiples remained lower than the 11x+ median seen in 2021 as well as the 9.5-10x range of 2017-2020; higher entry valuations from these years explain the reluctance of some sellers to accept recently available exit multiples.
- This year’s median multiple was weighed down by lower valuations paid on corporate-led deals (according to PitchBook), offsetting an increase for multiples on transactions with sponsor buyers as lending market conditions improved.
- Analysis of Baird Global Investment Banking’s sellside advisory transactions indicates headway for valuations in YTD 2024, with the median EV/EBITDA multiple up half a turn relative to 2023. Corporates and financial sponsor buyers have been near valuation parity overall in our deals, but sponsors have stretched higher than strategics for the most premium assets.
- Based on historical trends and LBO economics, purchase price valuations and deal financing leverage should rise as central banks in the U.S. and Europe reduce benchmark rates (detailed further here), reversing the pattern of purchase price multiples falling amid rising rates. The table below segments annual U.S. data from the last 17 years (including the previous two periods with Fed rate cuts) for yields on new broadly syndicated loans and EV/EBITDA valuation multiples into three groups based on average loan yields for each year.
Annual Averages for LBO Valuation Multiples in the U.S.
| Loan yields | LBO purchase price multiples |
| >8% | 9.3x |
| 6-8% | 10.0x |
| <6% | 10.3x |
Source: PitchBook LCD.
Data includes each year of 2007-2023.
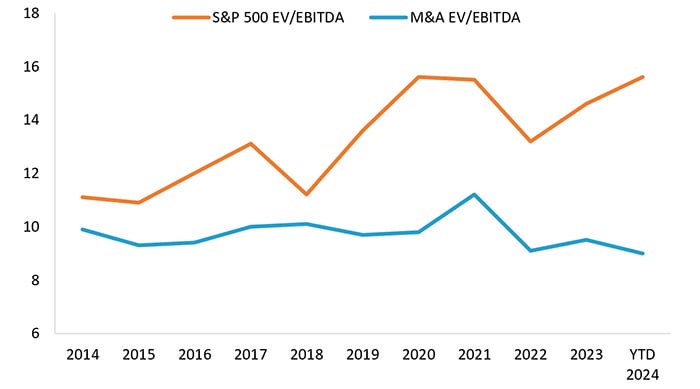
- As shown below, the recent gap between the median EV/EBITDA for M&A and for the S&P 500 was at its widest level in Q1-Q3 2024 at double the average disparity of 2014-2023, reinforcing the case that buyout valuations have room to rise.
Median EV/EBITDA Valuations for S&P 500 and M&A

Source: PitchBook.
We are optimistic about higher pipeline conversion rates across the global M&A market during 2025 based on the favorable status of underlying fundamentals and critical variables. Please contact Baird’s Global M&A team to discuss your M&A plans for next year.


