
Fed Rate Cuts a Catalyst for M&A Activity
We expect M&A activity to benefit from a series of benchmark rate cuts by the U.S. Federal Reserve through 2025. This phase of the rate cycle should feature reduced loan yields that lead to increases for leverage ratios and M&A valuations, particularly for LBOs. As in the past, easing rates and higher multiples are likely to stimulate additional M&A activity, particularly since the current backdrop seems more favorable than in the previous two rate cut periods.
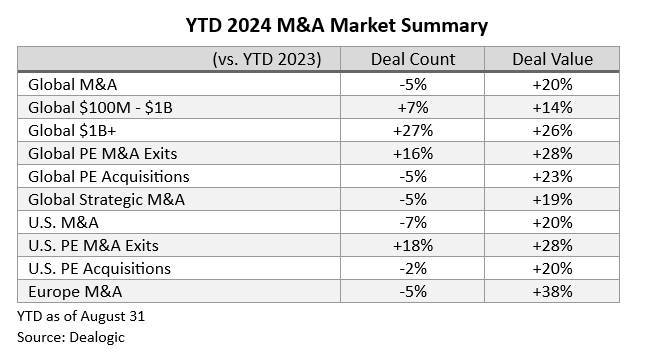
M&A Market Recovery in Early Stages
The global M&A market headed toward this rate cut phase already showing evidence of rebounding amid an increasingly favorable backdrop (as discussed here). The first Fed rate cut arrived later than estimated at the start of the year, factoring into the 5% decrease for the M&A transaction count in YTD 2024. Nevertheless, the first eight months of 2024 included several encouraging signs for the M&A market, with the 20% increase in disclosed deal value driven by strength in the $1+ billion segment, solid middle-market growth, and an upturn for PE M&A exit activity.
Lower Loan Pricing Should Lift Multiples
Based on historical trends and LBO economics, purchase price valuations and deal financing leverage should rise during the rate cut phase after falling amid rising rates. Although not moving in lockstep, loan yields and Fed rates usually trend in the same direction, with larger spreads during periods that warrant an extra risk premium.
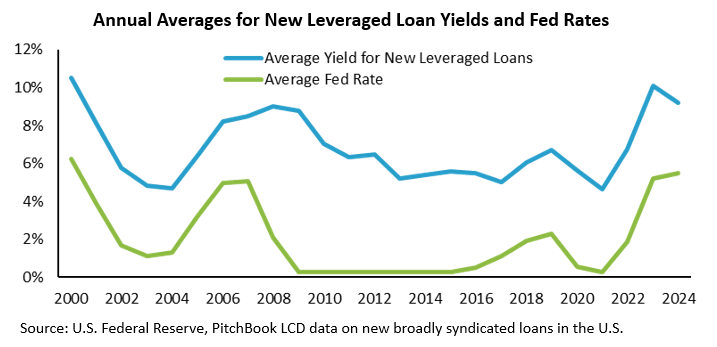
Our analysis of historical data indicates the rate cut phase should drive loan yields lower and leverage ratios higher. The table below segments annual data from the last 17 years (including the previous two periods with Fed rate cuts) for yields on new broadly syndicated loans and EV/EBITDA valuation multiples into three groups based on average loan yields for each year.
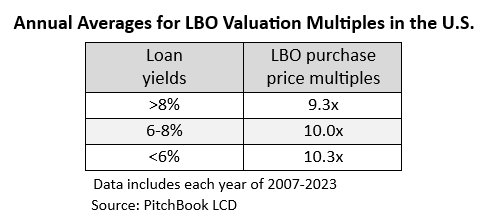
The overall data supports the intuition that lower loan interest rates contribute to higher LBO multiples. Positive correlation between loan rates and deal valuations has been overshadowed at times by other factors such as macroeconomic shocks or recessionary outlooks. However, as discussed below, we believe the current environment is conducive to lower new loan pricing and a corresponding uptrend for valuations.
Historical data demonstrates that valuation multiples, while driven by many factors, typically shift in the same direction as leverage ratios. The table below expands on the above version to include the average debt/EBITDA ratio of each yield segment. On average, higher debt ratios have been linked to valuation multiple expansion.
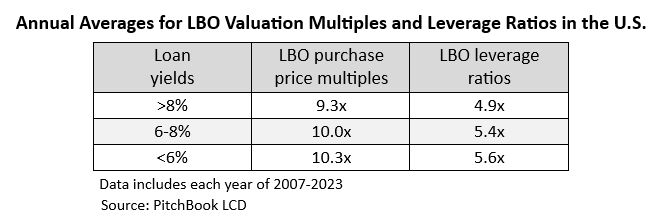
New loan yields could fall significantly in the upcoming period, thereby supporting increased leverage ratios and valuation multiples.
- Current futures pricing implies that the Fed will lower rates by 200-300 bps in total (including the recent reduction of 50 bps) through its last meeting of 2025.
- Loan pricing could steadily drop by a total of 200+ bps to below 8% over the next 12-15 months as expected Fed moves become reality.
- In view of the data presented above, loan yields decreasing to the 6-8% range would correspond to leverage ratios rising by a half turn or more from 4.8x EBITDA in H1 2024.
- History suggests valuation multiples could increase by nearly a full turn on average in this scenario.
An examination of the dynamics for loan yields and multiples during each of the last two rate cut cycles bolsters the argument for higher leverage ratios and LBO valuations over the next year-plus.
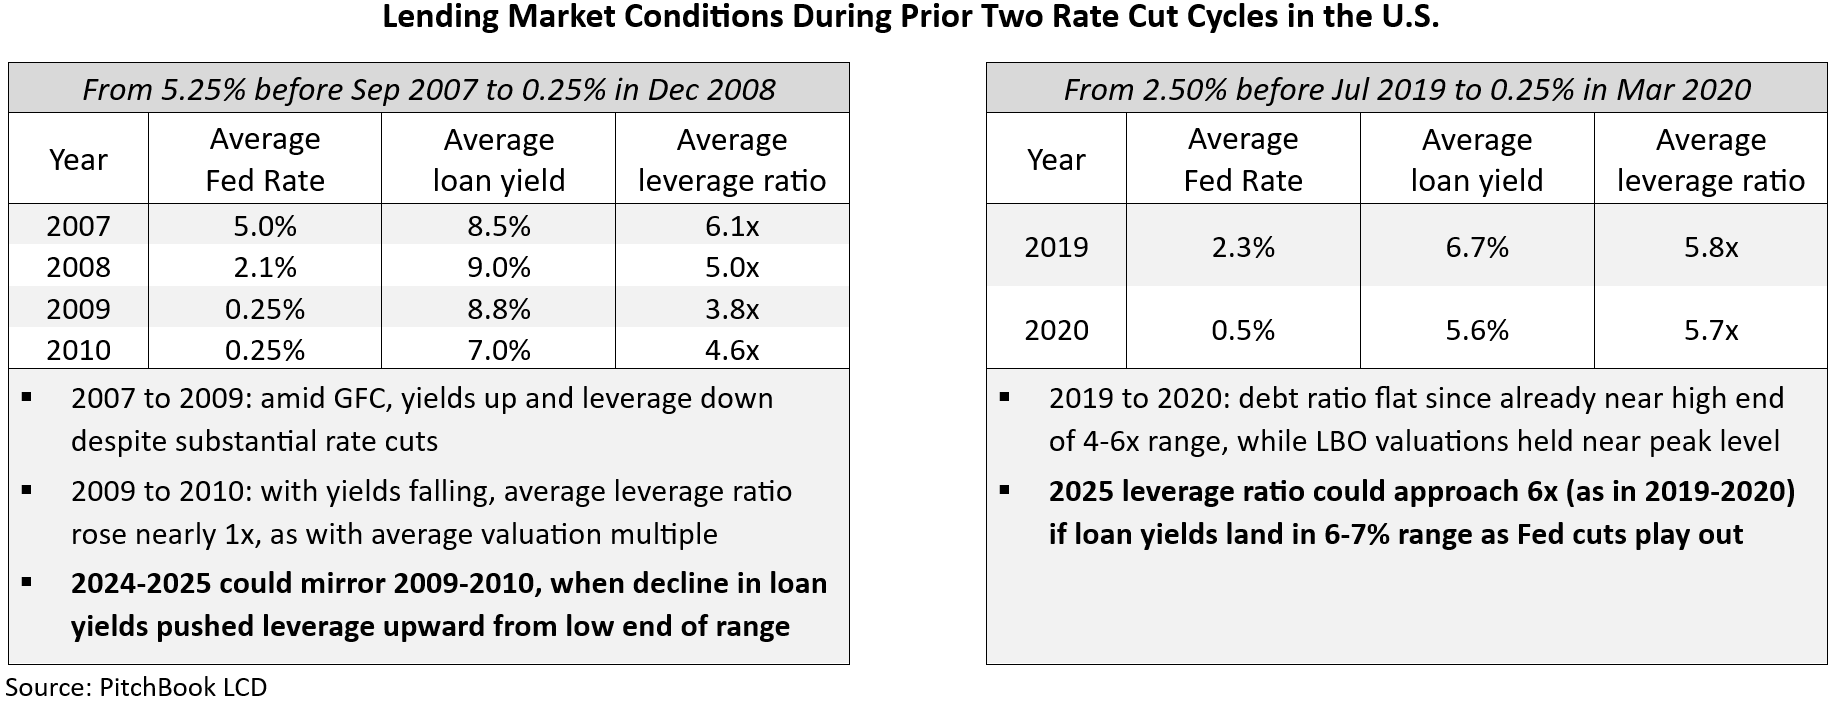
As discussed further in the last section of this piece, we view today’s backdrop favorably relative to the rate cut phases of previous cycles. Accordingly, we see potential for leverage ratios to rise (as in the first case summarized above) and to reach the upper half of the long-term range (similar to the second case).
Positive Impact of Fed Rate Cuts on M&A Activity
Based on historical trends, M&A activity should benefit from Fed-driven reductions in loan pricing and resulting increases to leverage ratios and valuation multiples.
Key points in our analysis of prior rate cuts:
- In the last two scenarios (with cuts starting in 2007 and 2019), rate cuts historically preceded GDP contraction, and M&A activity showed progress after economic expansion resumed.
- We excluded the January 2001 rate cut case due to factors that impeded M&A for an extended period, including economic weakness across 2001-2002 and a prolonged bear market (S&P 500 down 49% over 30 months).
- While our analysis focuses on U.S. M&A activity based on the closer tie to Fed rate actions, this discussion should apply to M&A during periods of monetary loosening in large markets such as Europe, where both the European Central Bank and the Bank of England typically move base rates in patterns similar to the Fed’s actions.
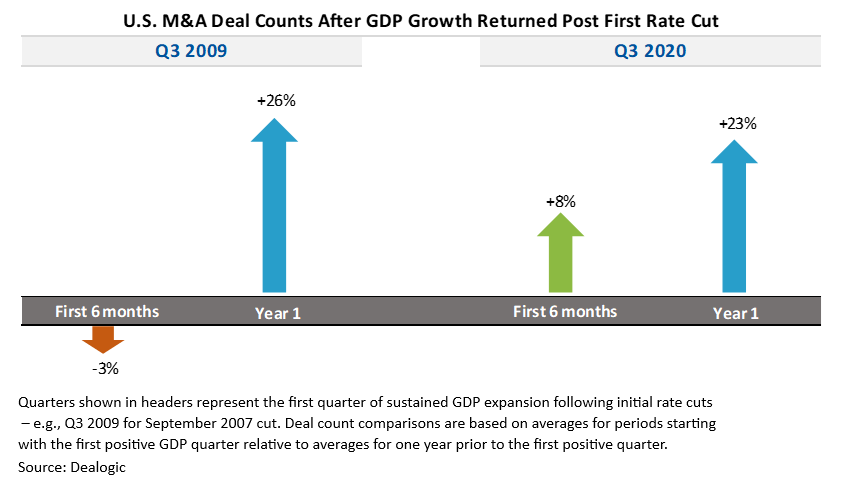
The last two Fed rate cut phases corresponded to a modest uptick for M&A transactions during the six months following these rate reductions, with roughly flat comparisons over the first full year. History may not be the best guide to future M&A results given the extreme negative factors experienced in these cycles. Indeed, we view the results as encouraging for the upcoming situation in view of severe macro shocks:
- The Global Financial Crisis (GFC) followed the September 2007 cut, with U.S. GDP shrinking in five of the six quarters through Q2 2009 and with the S&P 500 declining 57% from its peak through March 2009.
- The M&A market came to a virtual halt in April-May 2020 during the early stages of the COVID-19 pandemic, depressing the first-year data following the initial rate cut in July 2019.
To adjust for these factors, we also evaluated U.S. deal count data starting with the first quarter of sustained economic growth following the initial rate reduction. As indicated below, deal activity strengthened significantly in the first year after the return of extended GDP growth, as M&A market participants sensed improved macro conditions.
Current Environment Compares Favorably to Past Rate Cut Cases
The near-term M&A environment should be more supportive than during prior Fed rate cut phases, suggesting a larger pickup in transaction activity than witnessed in those cases.
Advantages vs. previous scenarios:
- The M&A market is unlikely to face challenges on the order of the GFC and COVID. Due to the higher risk premium following the GFC, the spread between the average loan yield and the Fed’s benchmark rate was 8.7% in 2009, far exceeding the 4-5% range for most years and representing a severe headwind for M&A.
- S. GDP is currently projected to expand in the quarters following the initial rate cut, contrasting with the prior two cases presented in this piece. As indicated in our analysis, M&A activity showed strength when the backdrop featured both GDP growth and recent rate cuts.
- Large equity market declines during the past two rate cut phases dampened deal valuations and M&A due to the lower multiples of public companies. The S&P 500 sank 46% from peak levels on average, with markets bottoming 12 months after the first rate cut.
- With private equity a much bigger driver of M&A than in the 2007-2008 case, improved LBO financing fundamentals should have a more positive impact on M&A activity. As an example, strong M&A gains starting in H2 2020 can largely be attributed to the major market power of financial sponsors, enhanced by the emergence of private credit as a key source of financing.
- On a global basis, control-stake M&A transactions with PE buyers rose from 30% of the total U.S. deal count in 2007 to 42% in 2023.
- PE dry powder has risen substantially over the past 17 years, supporting a robust equity component for valuation multiples. On a global basis, the PE capital overhang of $2.8 trillion is more than triple the amount from 2007.
- From 2007 to 2023, the number of PE portfolio companies in the U.S. more than doubled to reach 11,000+. PE-backed companies fuel M&A activity such as add-on acquisitions, secondary buyouts by other sponsors, and exit sales to strategic buyers.
Based on past experience and the current environment, Fed rate cuts over the next 12+ months should shift the M&A market into a higher gear, particularly as U.S. election-related uncertainty subsides. Please contact Baird’s Global M&A and Private Capital Markets teams to discuss your planned deal activity.