
M&A Market Recovery Set to Strengthen in Second Half
The global M&A market should build momentum during the second half of 2024 after showing the initial signs of a recovery during the first half of the year. In this piece, we detail improvement in the landscape for deal making over recent months as well as the positive status of leading M&A indicators. We also discuss how Baird’s recent and current sellside advisory processes suggest expanding buyer appetites, boding well for an upturn in the M&A market.
Mid-Year M&A Market Update
While the M&A market has not yet experienced a significant rebound, activity has moved higher from the lows of Q3 2023, while certain segments are sending encouraging signals of better results ahead. The absence of rate cuts by the U.S. Federal Reserve to date in 2024 has limited the breadth of the early recovery, with this catalyst now anticipated within the next few months.
H1 2024 M&A Market Summary
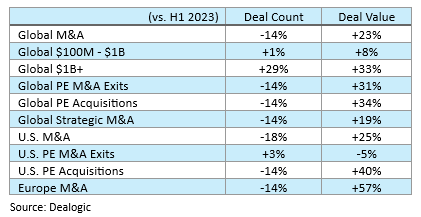
The points below summarize progress on many dimensions in the M&A market as of mid-2024, with the following sections providing further details:
- Good H1 2024 for leading indicators: large deals, PE exits, Baird’s processes
- Recent strength in $1+ billion deals on pent-up demand, healthier debt markets
- Modest growth for M&A metrics in the $100 million to $1 billion segment
- H1 2024: more PE M&A exits than H2 2023 amid the better backdrop for pent-up supply
- Valuation gap narrowing on the reduced cost of debt from lenders hungry for deals
- Sponsor acquisition deal value up on lower rates and as realizations rise
- Corporate M&A spending rebounding as C-level confidence improves
Additional context for H1 2024 data:
- H1 2024 deal counts may be understated by 5%+ relative to the eventual total based on historical experience with the M&A database, suggesting better comparisons versus H1 2023 than shown above.
- After two down years in 2022-2023, another full-year decline for deal count in 2024 would buck historical trends. In the prior three instances of a second consecutive annual decrease, the years afterward (2010, 2014, and 2020) witnessed transaction growth averaging 13%, reflecting the buildup of supply and demand for assets. Easier comparisons starting in Q3 result in potential for deal count growth in 2024 if second-half activity ramps up as anticipated.
H2 2024 Outlook
This piece makes the case for a faster pace of deal making in H2 2024. Recent gains in key market segments support our conviction in a wider rebound over the balance of this year and beyond. Our expectations of stronger M&A results are also a function of a better backdrop for deal activity along with positive indicators from our sellside advisory processes.
Leading Indicators Still Pointing Up
Our outlook of better M&A market performance in the near term is founded in part on a recent upturn for leading indicators of a wider rebound in M&A activity. As detailed in our April piece, U.S. deal counts for (1) M&A transactions with disclosed value of $1+ billion and (2) financial sponsor M&A exits represent effective leading indicators of forthcoming gains in the M&A market. Our thesis regarding these indicators remains intact through Q2.
The outperformance of large deal activity in H1 2024 is a good sign for the overall M&A market.
- In H1 2024, the number of $1+ billion U.S. transactions was 14% above the quarterly average of 2023 and 16% higher than the 2022-2023 mean.
- Significant growth in this segment contrasted with the U.S. deal count declining 7% in H1 2024 from the 2023 average.
The number of U.S. PE M&A exits rose in H1 2024, as also seen toward the end of prior downturns, when PE firms focused on producing distributions for limited partners (LPs).
- In H1 2024, the estimated transaction count for U.S. sponsor M&A exits was 17% above the run rate for 2023.
- Adjusting for expected data revisions, this represents 15-20 percentage points of outperformance relative to the overall M&A market.
The data reflects PE firms resuming many previously delayed sale processes as market conditions improved while also signifying progress toward more balanced valuation viewpoints among buyers and sellers. In addition, renewed growth for bigger transactions illustrates increased confidence for buyers and better visibility into the financial results of targets and buyers – factors that should benefit incremental deal making on a broader basis in the upcoming period.
Encouraging Signs in Baird’s M&A Advisory Processes
Our confidence in the merits of the leading indicators noted above is reinforced by positive metrics throughout our sellside process activity. For recently signed deals as well as current mandates, we have seen more sponsor and corporate buyers actively pursuing their M&A strategies. Further, private equity sellers are responding to stronger buyer appetites by bringing more companies to market, leading to growth in active engagements and a faster pace of process launches.
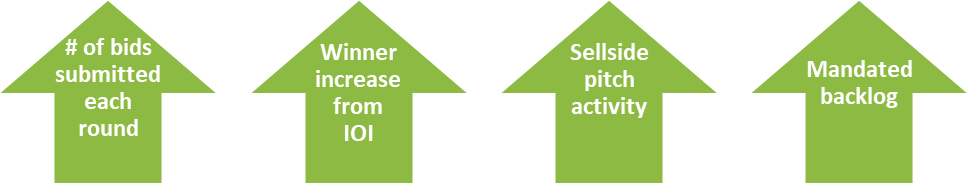
Based on substantial improvement for bid progression dynamics in our processes, we believe more prospective acquirors are now leaning into buying opportunities, which should translate to an increased number of deal announcements in the M&A market across H2 2024. Examples include:
- During H1 2024, every bidding round included more bids on average than in each of the past three years. While recent gains were strongest relative to the last two years, bidding activity also picked up noticeably in comparison to the M&A boom of 2021.
- For a solid majority of our closed H1 2024 sellsides, the ultimate buyer emerged with the highest offer in the final round after a different bidder submitted the highest first round indication of interest. Among the top final bidders, the proportion that were not the leading first round bidders was 10 percentage points higher than the 2021-2023 average, exceeding each year’s share.
- Due to more competition throughout processes, eventual buyers raised their bid from their initial indication of interest by a much larger amount than in the preceding three years. A more aggressive stance was especially evident among sponsor buyers, in clear contrast with relatively cautious behavior in 2022-2023.
Conditions have improved relative to last year even for processes not experiencing each of the trends outlined above. Certain situations where we have seen more limited buyer participation have still been more productive than in 2023 in terms of deal agreements being reached, reflecting the valuation expectations of sellers and buyers moving closer together.
The upturn in PE M&A exits noted previously is providing tailwinds to our business due to the prevalence of mandates to sell sponsor holdings. Positive internal indicators also include substantially increased pitch activity, leading to growth in our engaged backlog and additional process launches. Our active backlog has expanded even after much of the year-end 2023 pipeline has cleared due to 60%+ growth in announced transactions and a 70%+ increase for deal value in our M&A advisory business during H1 2024.
H1 2024 Improvements in Baird’s Sellside Advisory Activity
As with the process dynamics described above, we believe increased internal deal flow reflects greater confidence among market participants, which should translate to a faster rate of transaction announcements in the M&A market during the second half of the year. These expectations are supported by recent commentary from M&A data room providers regarding H1 2024 metrics, including Datasite noting 20%+ growth in global sellside kickoffs and SS&C Intralinks citing double-digit growth in pre-announced deal activity in North America.
Supportive M&A Drivers
Fundamental forces in the M&A market should fuel more deal making in the second half of the year and in 2025.
Substantial Sponsor Supply
- On a global basis, the number of sponsor M&A exits in the first half fell 14% year over year but rose 5% relative to H2 2023.
- Pressure to increase distributions to LPs is requiring PE firms to prioritize liquidity events, driving the recent uptick for M&A exits and our strong internal process metrics.
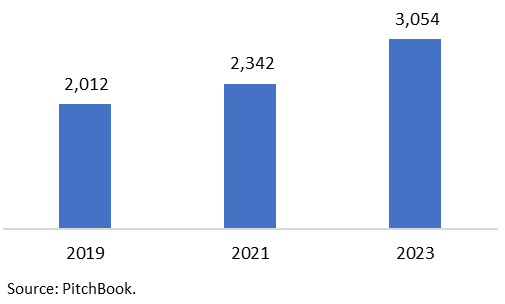
- Financial sponsors still have a long “to do list” in terms of generating realizations for portfolio companies, as the number of portfolio companies held for 4-6 years has risen 50%+ since the end of 2019, which should lead sponsors to aggressively explore liquidity options in H2 2024 and in 2025.
PE Holdings Acquired 4-6 Years Earlier
Renewed PE Buying
- As lending market terms improved, PE firms have begun to undertake larger acquisitions after frequently staying on the sidelines in 2022-2023. The disclosed deal value of sponsor acquisitions in H1 2024 rose 34% on a global basis despite a transaction count decline of 14%.
- Sponsors still have massive pent-up demand in view of seven-year lows for acquisition deal count and deal value in 2023 as well as $2.6+ trillion of global dry powder (as of mid-2024), which has risen 65% since the start of 2020.
- Regarding PE M&A by sector in the U.S. (with Europe activity covered in a separate piece):
- Industrial and Services sectors continue to account for half of activity; many recent transactions featured high-quality companies, often backed by recurring revenue streams or demand driven by certain mega-trends, such as the proliferation of data centers required for AI processing and the buildout of electrical grid infrastructure.
- Consumer PE activity is recovering as the U.S. economy and labor market continue to outperform. Consumer-focused sponsors have honed their ability to identify companies in certain “premium” categories that benefit from secular tailwinds.
- With Software & Technology and Healthcare producing the highest valuations earlier in the M&A cycle, some PE owners are reluctant to exit portfolio companies in these sectors at a lower multiple. However, we are seeing a return to robust valuation levels in our own sellside processes in 2024, particularly for high-performing Software and Healthcare IT businesses.
U.S. PE Acquisition Count Mix by Sector
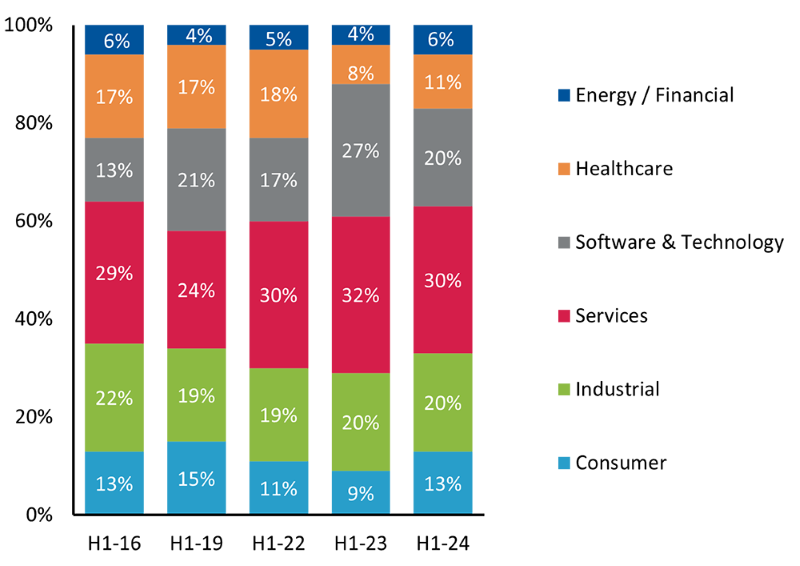
Source: PitchBook. Baird deal-by-deal analysis for sector allocation.
- For Baird’s sellside advisory transactions in H1 2024, financial sponsors generally closed acquisitions at higher EBITDA multiples than strategic buyers and at increased valuations relative to last year. This pattern applied both to median valuations as well as for the highest-quality assets (using the 75th percentile of multiples as a proxy) and contrasted with the bottom of the M&A cycle (H2 2022 through late 2023), when sponsor purchase price multiples trailed the levels of corporate buyers. The recent willingness of PE firms to pay up suggests potential for an even more aggressive approach if financing rates decline further.
- Global fundraising results were mixed in H1 2024, when the amount of capital raised was similar to the run rates of both 2022 and 2023. However, successful closings skewed toward larger sponsors, as the annualized number of funds would be the lowest total since 2010.
Strategics Thinking Bigger
- In H1 2024, the deal count for strategic acquisitions decreased 14% due to contraction for the number of smaller deals; strength in the large transaction segment drove 19% growth in disclosed deal value.
- Despite rising competition from sponsor buyers, corporate acquisition activity (which represents about 60% of M&A) should pick up over the back half of the year. That noted, many strategics may opt for a highly selective approach after being well positioned as differentiated buyers when the financing markets eroded during H2 2022 through late 2023.
- Drivers of a future uptrend in strategic activity include increased C-level confidence, strong cash positions, bright earnings prospects, and higher public equity values.
- Many strategics have the financial means to pursue major acquisitions:
- Cash holdings have risen 70% over the past eight years to $4+ trillion for publicly traded companies (excluding the finance sector) based in the U.S., Europe, or Japan.
- Further growth in corporate earnings should add to cash balances, as EBITDA growth for the S&P 500 is projected at 13% in 2024 and 12% for 2025.
- Among $1+ billion deals announced by public companies during H1 2024, stock was a component of consideration in nearly half, reflecting enhanced buying capacity.
- Greater conviction in company outlooks and the broader economy, as evident in separate surveys of CEOs and CFOs, has allowed more corporate management teams and boards to give the green light to key transactions.
Friendlier Financing Markets
- Despite the lack of Fed rate cuts through mid-2024, lending market conditions continue to be constructive, featuring strong activity along with tighter pricing and more flexible terms across the private and public markets.
- Evidence of healthy support from private credit in Q2 included high levels of direct lending deal completions, record $1+ billion transaction activity, and spreads falling to the lowest level since early 2022.
- Robust public market activity featured an 11-quarter high for leveraged loan volume in Q2, multi-year peaks for high yield issuance in the first half, and pricing for loans and bonds subsiding to mid-2022 levels.
- Encouraging findings regarding the outlook from quarterly lending market survey released in late June:
- 50% of responding market participants expect near-term credit conditions to ease (up from 34% in March).
- 68% anticipate higher leverage multiples on buyouts over the next six months (up from 41% in March).
Additional M&A Market Considerations
- We expect the favorable process dynamics described above to include challenges that partly offset the benefits of more buyer engagement driving added competition within processes. As additional assets enter the market, buyer capacity could become increasingly constrained, especially if the start of Fed rate cuts stimulates significant exit activity. We also anticipate certain parties to “test” the valuation environment, possibly through targeting a multiple more applicable to a previous phase of the M&A cycle.
- Bullish signs for the M&A outlook include the strong performance of the equity markets, which often are a leading indicator of M&A activity due to typically corresponding to increased confidence in C-suites and boardrooms. For the seven years during 2003-2022 when the S&P 500’s return exceeded 16% (as occurred in 2023), the number of U.S. M&A transactions was flat on average, whereas deal counts rose an average of 15% in the seven follow-up years.
- Even as M&A market conditions improve, GP-led continuation vehicles (CVs) should remain a valuable option for certain scenarios given the pressure on financial sponsors to generate liquidity for LPs. According to data compiled by Baird’s Global GP Solutions Group, the CV market is on track for further expansion, as aggregate deal values for single asset and multi-asset CVs rose substantially in H1 2024. Our recently released report details this market’s major long-term growth potential while featuring key themes and best practices for executing CVs.
- In the U.S., uncertainty about the outcomes and impact of November’s presidential and congressional elections could influence timing plans for deal makers, particularly in certain sectors. Of note, 2012 and 2016 experienced modest effects on aggregate M&A activity soon before and right after elections, while data was distorted by large shocks around the elections of 2008 (GFC) and 2020 (COVID). In the current election cycle, we have not yet seen a meaningful impact on the M&A market from the major campaign events that occurred in recent weeks.
- Early indicators point to a strong M&A market in 2025, as potential rate declines coupled with post-election tax changes could catalyze a higher level of activity. While election uncertainty represents a near-term wildcard, an initial Fed rate cut before year-end would be an offsetting factor that should enhance M&A appetites. Currently, the implied probability of a rate cut at the Fed’s September meeting exceeds 80%. Our prior analysis of historical data determined that past Fed rate cuts provided support to M&A activity in the following one to two years, strengthening the case for a broader rebound beginning before year-end.
Please contact Baird’s Global M&A team for further details on key trends within our processes and to discuss your M&A plans.